Dashboards
1. Sales Data Analysis
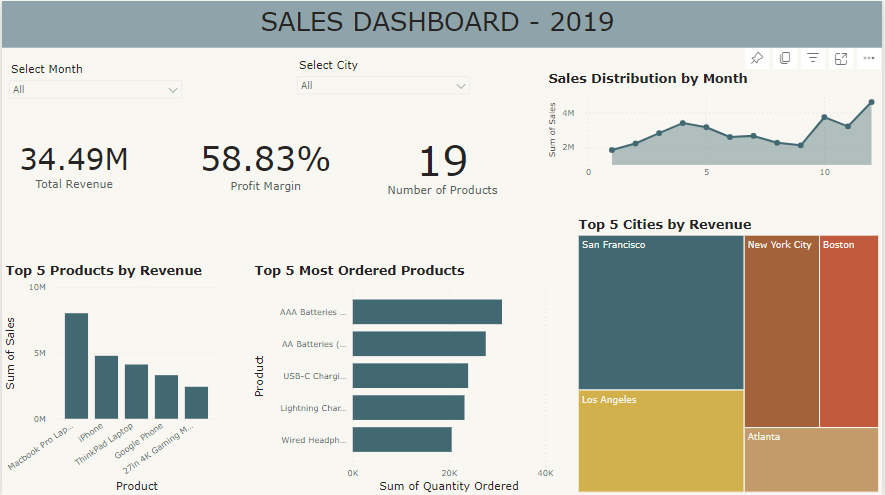
In this project, I dive into a large sales dataset to extract valuable insights. I explore sales trends over time, identify the 5 best-selling products by revenue and orders, calculate revenue metrics; total sales, and profit margins, and create visualizations to present my findings effectively.
View Details2. Data Professions Survey
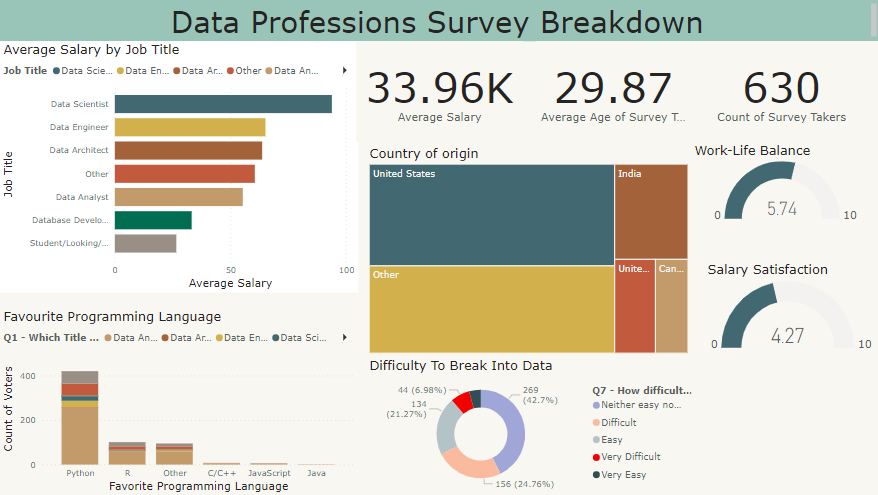
This analysis offers a concise overview of the data industry, focusing on average salaries across roles, salary satisfaction, work-life balance, favorite programming languages, the challenge of entering the field, and key performance indicators. The insights provide valuable benchmarks for professionals and employers, shedding light on industry trends and guiding strategic decision-making.
View Details3. House Sales Analysis
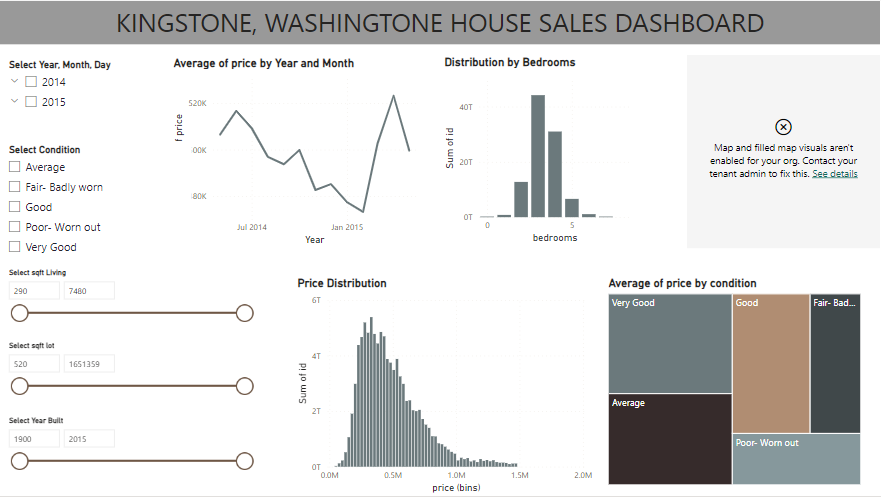
In this analysis, I delved into crucial aspects of the real estate market. Firstly, I examined the average house prices, offering a detailed breakdown by year and month.
This insight into pricing trends over time is invaluable for understanding market fluctuations. Additionally, I explored the price distribution, shedding light on the affordability landscape
and market pricing patterns. By breaking down prices based on the number of bedrooms, I provided targeted information catering to the varying needs of potential buyers.
Moreover, the inclusion of interactive slicers allowed for dynamic filtering by time, size, and condition of the houses. This interactive feature enhances the usability of the data,
enabling users to customize their analysis and extract pertinent information tailored to their specific requirements. Overall, this analysis equips stakeholders with a comprehensive understanding of the Kingstone housing market,
empowering them to make informed decisions in the dynamic real estate landscape.